Ultra-High Definition Television (UHDTV) as it is specified in ITU-R BT.2100 consists of four main features compared to the current legacy HDTV format (High Definition Television):
- High Resolution (e.g. 2160 lines, progressive only)
- High Frame Rate (HFR)
- High Dynamic Range (HDR)
- Wide Colour Gamut (WCG).
Investigations and various demonstrations (e.g. at IFA or IBC 2019 by IRT) have shown
that the usage of HDR and WCG have the highest impact for the user experience
compared to the current SDR (Standard Dynamic Range) television system. The
difference is clearly visible compared to current SDR and it is independently from
the spatial resolution (1080p or 2160p).
There already exist some premium
productions in HDR (e.g. Football Championships 2018, Royal Wedding, French Open,
etc.) using production equipment which can handle HDR natively through the complete
broadcasting chain, but the main delivery format is still SDR at least for the next
coming years – a live conversion of broadcast signals (e.g. live cameras,
graphic insertions, archive material, etc.) is needed in all possible directions
(SDR to HDR, HDR to SDR and HDR to HDR).
HDR implies a higher contrast compared
to SDR – more details in dark areas and more highlights in bright areas are
possible. It does not mean “just brighter pictures”. Furthermore, HDR is linked to
WCG. If HDR is used, the wide colour gamut (as specified in ITU-R
BT.2100) is mandatory. The colour space model used in television is based on
the Human Visual System and it is a non-linear approach – just increasing the colour
space (up conversion) or performing a hard clip (down conversion) will introduce
artefacts (e.g. colour-shift, under-saturation/over-saturation) which can be visible
in different levels of perception. There is no prescribed way how to perform such
conversions, each manufacturer can implement its own conversion algorithms but
according to the required specifications.
Therefore, with the introduction of UHD and its feature HDR it becomes necessary to keep an eye on colour science and its trapdoors which were already there when moving from SDTV to HDTV (but not that obvious). Troubleshooting in doing colour space conversions from SDR to HDR or vice versa will come. And due to the complexity of colour space conversions there are multiple aspects that have to be considered and which even might affect each other.
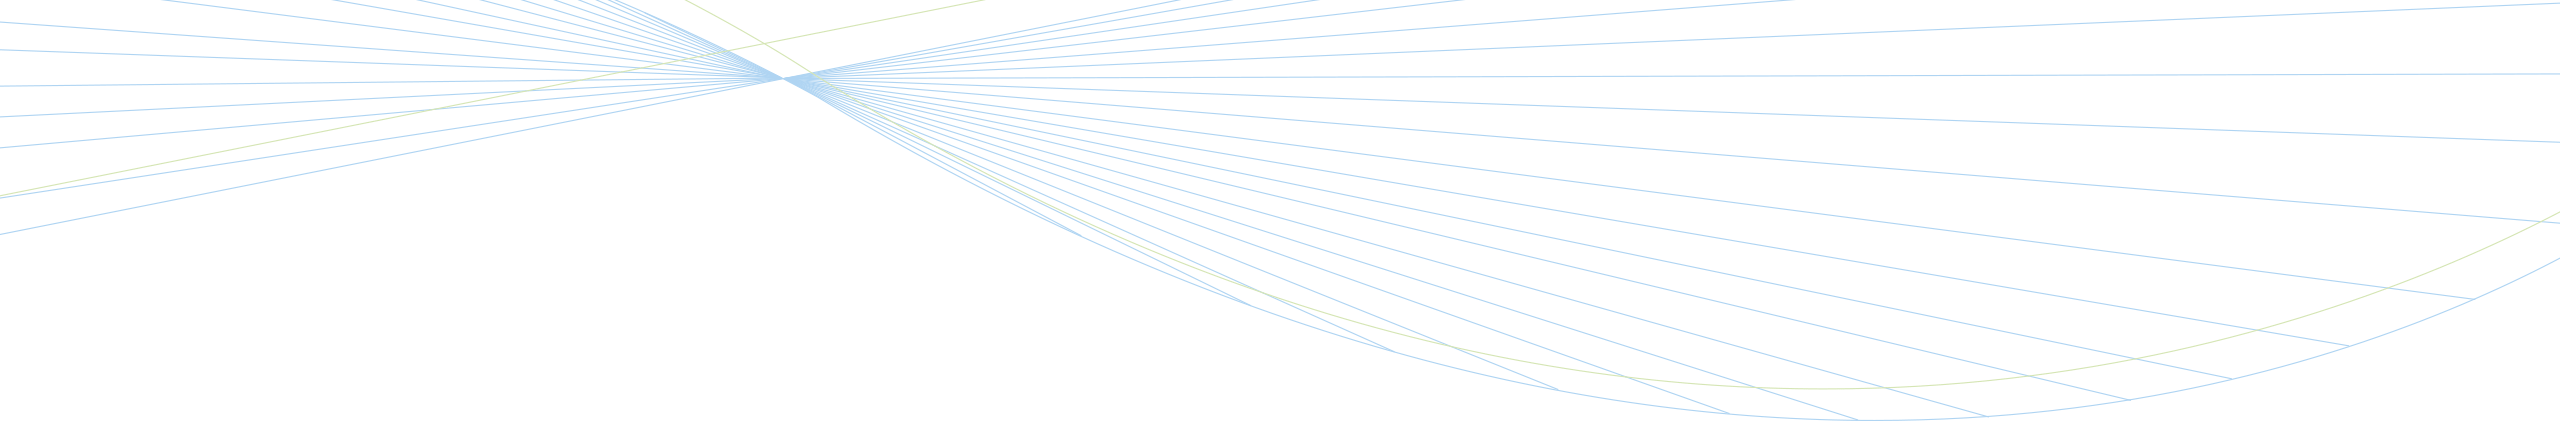
The chromaticity diagram (CIE 1931) is one of the best-known diagrams in colour science (see figure 1). This diagram specifies the chromaticity regardless of its luminance which means that the chromaticity diagram is only a cross-section at a defined luminance not showing colours e.g. at higher luminance levels. For SDR video this might have been sufficient but for HDR content the luminance is much higher and therefore has to be taken into account.

Within the chromaticity-diagram (see figure 1) there are painted two triangles:
- One triangle in green (according to ITU-R BT.709) which represents the smaller colour gamut commonly used in SDR with a resolution of HDTV (see table 1).
- One triangle in black (according to ITU-R BT.2020) which represents the wide colour gamut used for HDR.
If you would like to convert from e.g. BT.2020 to BT.709 you have to desaturate the colour. If you act in instinct you would probably go straight to the white-point (red chain lines in figure 1). But that would cause a colour-shift because the “lines of constant hue” (grey dotted lines) are not straight. For example, if you might follow the red chain line, blue gets slightly purple, orange gets slightly red and yellowish green gets slightly green. In order to preserve the correct colour you have to do it different. And that is a challenge, even in 2D.
In order to visualize how complex colour conversion is and to indicate the trapdoors
in the process, the IRT Future Video Team built 3D-models in order to visualize the
maximum possible colours for High Dynamic Range (HDR).
These colour volumes are
an educational tool to explain and help the broadcasters to understand the
complexity of SDR <-> HDR conversions and to locate possible artefacts that
might become visible during production.
The shape of the colour volume is not a
simple cylinder or cone as some people might expect. What you rather see is that the
shape of the colour volume gets more and more distorted the higher the luminance
gets. And this does not happen symmetrically for the three Primaries (Red, Green and
Blue) which are the three points that span the triangle at the bottom of the colour
volume. There are several standards needed for HDR and SDR to create a volumetric
representation of the colours and the luminance that are maximal possible:
- ITU-R BT.709
- ITU-R BT.2020
- ITU-R BT.2100 (where the use of BT.2020 is mandatory)
Table 1 gives an overview of the relationship of the dynamic (which defines the volume or “height” of the colour space) and the RGB-Primaries (which define the base of the colour volume in a triangle).
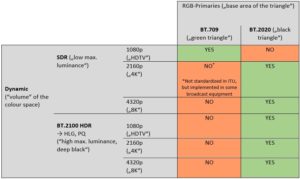
Table 1
There are four colour volumes mentioned in this article and presented in a short video-demo:
- A volumetric representation of the maximal possible colours in BT.709-SDR
- Two volumetric representations of the maximal possible colours in BT.2020-HDR
according to ITU-R BT.2100
– one calculated for Hybrid Log Gamma (HLG)
– one for Perceptual Quantizer (PQ) - A volumetric representation of a hypothetical HLG-Display (Device under Test, DuT)
(4 colour volumes: from left to right):
BT.709 SDR | BT.2100 HLG | BT.2100
HLG Device under Test | BT.2100 PQ

Due to the logarithmic representation of the four colour volumes in figure 2
and its demonstration in parallel you can get an impression of how different the
shapes are.
(4 colour volumes, from left to right):
BT.709 SDR | BT.2100 HLG | BT.2100
HLG Device under Test | BT.2100 PQ

The shape and the distortion of the colour volume is clearly visible in the linear
representation. The base area is again the triangle like in the logarithmic
representation. But this is only the case for low luminance levels. The higher the
luminance gets the more the shape differs from a triangle and leads into one point
which is the maximum luminance.
You can find out more about the
different colour volumes – according to their specifications – in the
videos below. These videos enable you to move around the colour volume and show the
distortions from a 360°-view.
Please note, that the colour volumes are
shown in their linear representation in the videos (see
figure 3):
- The “BT.709-SDR-colour volume” has the smallest volume (“green triangle” as base
area and maximum luminance is 100 cd/m²)
- The “BT.2100-HLG-colour volume” has the BT.2020-Primaries (“black triangle”) as
base area and a maximum luminance of 1.000 cd/m²
=>The example colour volume, BT.2100-HLG-Device-under-Test (DuT), is over all smaller than the BT.2100-HLG-colour volume, as the hypothetical DuT does not reach the maximum possible colours or the possible luminance
- The “BT.2100-PQ-colour volume” has the BT.2020-Primaries (“black triangle”) as
base area and a maximum luminance of 10.000 cd/m²
Note: In a previous version of this article we used the vernacular term „HDR-Crystal“ (used internally because of its shape) which is not the technical correct term. In order to avoid confusion with a new term we decided to change the term into the technical correct one.